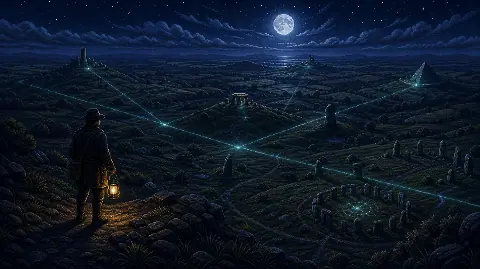
What Is the 30th Parallel?
The 30th parallel north is the circle of latitude 30 degrees north of the equator. It is a coordinate, not a physical boundary. A place at 33°N is about 333 km north of it, even if both places look close on a small world map.
Define how wide the proposed corridor is before collecting examples. A band from 29°N to 31°N is about 222 km wide. Expanding it to 25°N through 35°N makes it roughly 1,110 km wide and changes the claim substantially.
NOAA explains latitude and the approximate 111 km per degree.
How Close Are the Named Locations?
The table compares five identifiable places, not a statistical sample of UFO sightings. The three US entries use Census representative points for the cities, not claimed object positions, crash sites or the full extent of a sighting.
| Place | Latitude | Distance | What the Comparison Shows |
|---|---|---|---|
| Giza Pyramids, Egypt | 29.978°N | 2.5 km south | Very close to 30°N. Proximity alone does not connect the monuments to UFOs. |
| Chichén Itzá, Mexico | 20.681°N | 1,030 km south | This major Maya site is far from the parallel. It cannot support a narrow alignment claim. |
| Roswell, New Mexico | 33.373°N | 374 km north | Outside a 29°N to 31°N band. The city point does not locate the 1947 debris field. |
| Phoenix, Arizona | 33.572°N | 397 km north | Outside a 29°N to 31°N band. A city point cannot describe every Phoenix Lights report. |
| Stephenville, Texas | 32.215°N | 246 km north | Also outside that band. A claim about a particular observation needs its own coordinates. |
Calculation: absolute difference between the source latitude and 30°, multiplied by 111 km. Distances are rounded north-south separations, not driving distances. Coordinates identify reference points within places; they are not exact boundaries. No sighting-density analysis was performed.
Giza coordinates: UNESCO's Portal to the Heritage of Astronomy.
Chichén Itzá coordinates: UNESCO protection register, page 4.
City coordinates: US Census Bureau 2024 National Places Gazetteer.
What the Pentagon's Hotspot Map Actually Shows
AARO's November 2023 reporting graphic includes a world map labelled “Reported-UAP Hotspots”. A map of reports records where observations entered a collection system. It does not establish how often unidentified objects occur per hour of observation at every latitude.
AARO reporting graphic, 20 November 2023.
The FY2025 AARO report, released in July 2026, explicitly identifies collection bias towards the continental United States, its coastal waters and US military operating areas worldwide. Places with more US military sensors and assets tend to submit more reports. This limits what can be inferred from clusters on the map.
AARO FY2025 annual report, executive summary.
Collection bias does not identify an individual object or show that every report has the same explanation. It means the map cannot by itself distinguish an unusual concentration of objects from an unusual concentration of opportunities to observe and report them.
Ancient Sites and Climate Need Separate Explanations
Giza's proximity to 30°N is real. Its monuments also have documented astronomical orientations, including the pyramids' alignment with the cardinal directions. Orientation describes which way a structure faces; latitude describes where it stands. One does not establish the other as evidence of extraterrestrial involvement.
Chichén Itzá is a clear geographic counterexample to placing the Maya along 30°N. Civilisations occupy territories, not single coordinates, so a claim about Egypt, the Maya or Sumer needs named sites and a consistent distance rule rather than a label on a world map.
Nor is 30°N a continuous belt of mild, fertile land. NOAA describes the subtropical regions around 30° north and south as the horse latitudes, where descending air favours dry conditions. Local water supplies and geography must be examined separately from a latitude alignment.
NOAA on the horse latitudes and dry conditions.
How to Test a 30th-Parallel UFO Claim
- Fix the boundaries first. Specify north or south, the allowed distance from 30°, a time period and the database to be used. Do not widen the corridor after seeing which famous cases miss it.
- Locate the observation. Separate the witness location, the estimated object position and a nearby town used as a reference. Record uncertainty instead of assigning a precise point to a vague report.
- Count independent events. Multiple witnesses, media stories and reposts may refer to one event. Keep the original records so duplicates and later identifications can be checked.
- Compare observation opportunities. Examine sensor coverage, observing hours, population, flight activity, weather and access to reporting. Raw totals alone cannot show whether latitude adds explanatory power.
- Test the rule elsewhere. Compare other latitude bands and a separate time period using the same criteria. A pattern chosen after inspecting a map needs independent confirmation.
An unexplained sighting and an unexplained geographic pattern are different claims. The first needs evidence about an event. The second needs a reproducible dataset, fair comparisons and uncertainty estimates. Neither follows from drawing a line between selected examples.
Explore the UFO sighting case files.
Is There Evidence of a Magnetic UFO Corridor?
The AARO records and geographic sources cited here do not demonstrate a magnetic corridor, an alien navigation route or an energy line at 30°N. Testing such a mechanism would require measured field anomalies at specified locations and a repeatable relationship with independently documented events. A latitude coincidence supplies neither measurement.
The topic remains worth investigating through records that can be mapped and compared. Start with an exact location and an original report, then check whether the proposed pattern survives consistent boundaries and differences in observation coverage.